← Year 5 geography worksheets

Year 5 Energy: how do we power the world? worksheet

“Where our power comes from” is free to print, with no account. It is the first sheet in the Year 5 geography unit “Energy: how do we power the world?”, for children aged 9 to 10, and takes about 20 minutes.

Print it on A4. The child's pages come first; the answers, and what each wrong answer tells you, are on the grown-up page that follows. Weeks 19 to 24 of the year, 6 sheets in the unit.

Free sample · answers on the last page

Where our power comes from

Name: ____________ · Date: ____________
Year 5 · Geography · about 20 minutes
Answers are on the grown-up page

Today I can read a bar chart of UK electricity sources and say which gave the most.

A Look back3 min

  1. 1.

    Circle the missing point on the compass.

    NNESESSWWNW
    NorthEastSouthWest
  2. 2.

    Circle the square that has the pond.

    ABCD1234~N
    C1B3D4
  3. 3.

    Circle the feature in square D4.

    ABCD1234N
    ShopTreeChurch

B Watch me, then you4 min

The bar chart shows where the UK's electricity came from in 2022, as a percentage of the total. Which source gave the biggest share?
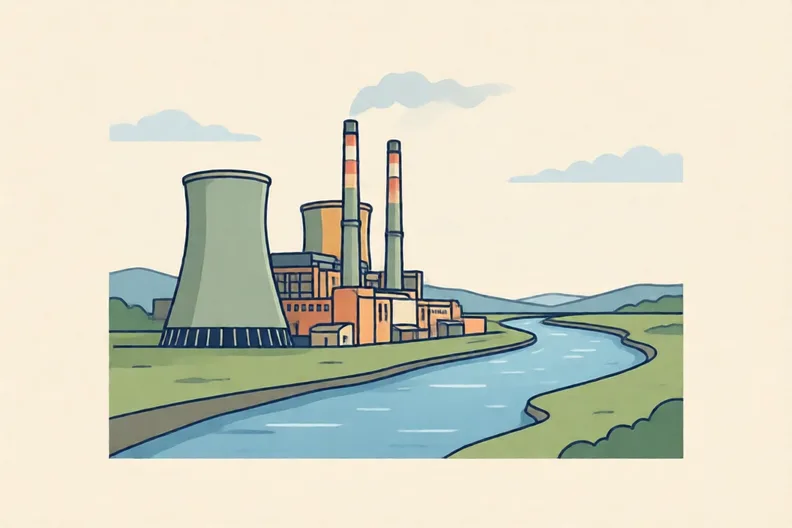
A large power station beside a wide river, with tall chimneys and no people
Watch me
UK electricity in 2022 (% of total)02468101214161820222426283032343638404244464850Fossil fuelsRenewablesNuclear

Look at the tallest bar. It is renewables at 42%.

Fossil fuels were close behind at 40%.

So renewables gave the biggest share.

Now you
  1. 1.

    How many percentage points more did renewables give than nuclear?

    UK electricity in 2022 (% of total)02468101214161820222426283032343638404244464850Fossil fuelsRenewablesNuclear

C Your turn7 min

Read each bar. Where a number is missing, count the gridlines to find it, then write the percentage.

  1. 1.

    What percent of UK electricity came from fossil fuels in 2022?

    UK electricity in 2022 (% of total)02468101214161820222426283032343638404244464850Fossil fuelsRenewablesNuclear
  2. 2.

    What percent of UK electricity came from renewables in 2022?

    UK electricity in 2022 (% of total)02468101214161820222426283032343638404244464850Fossil fuelsRenewablesNuclear
  3. 3.

    What percent of UK electricity came from nuclear power in 2022?

    UK electricity in 2022 (% of total)02468101214161820222426283032343638404244464850Fossil fuelsRenewablesNuclear
  4. 4.

    How many percentage points more did renewables give than fossil fuels?

    UK electricity in 2022 (% of total)02468101214161820222426283032343638404244464850Fossil fuelsRenewablesNuclear

Say it out loud: Which bar did you have to find, and which bars did you need to compare?

D Spot the mistake3 min

Kit says: “Coal made the most of our electricity in 2022, so it is our biggest energy source.”
UK electricity in 2022 (% of total)02468101214161820222426283032343638404244464850Fossil fuelsRenewablesNuclear
  1. 1.

    Coal is one kind of fossil fuel. Use the chart to explain why Kit is wrong.

E Think deeper4 min

Look at the wind farm. Think about the bar chart as well.
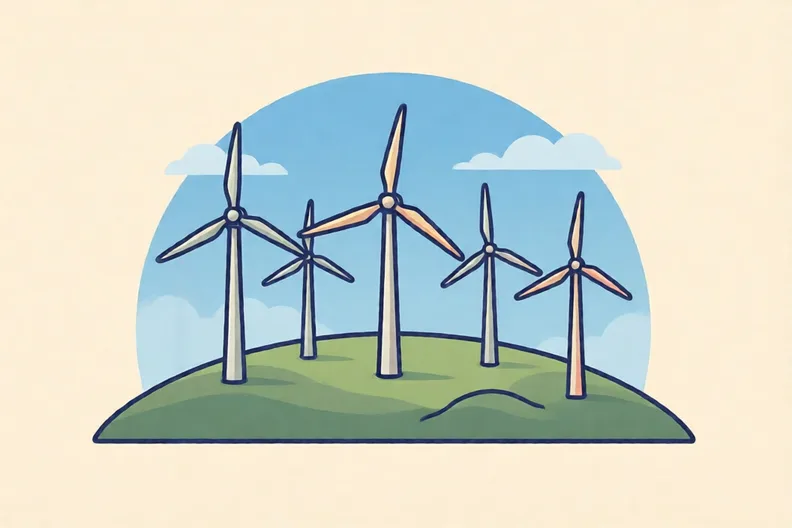
A row of wind turbines on a green hill under a blue sky
  1. 1.

    Suppose the UK built many more wind farms. Would the share from fossil fuels go up or down? Explain in two or three sentences.

How did it feel?

I can do it Nearly Not yet
StudyDen · Year 5 · Geography · Energy: how do we power the world?Answers are on the grown-up page

For the grown-up

Where our power comes from · 2 minutes to read

Answers, and what a wrong one tells you

A

1. East If your child chose West, ask which way the sun rises. East goes on the right side of the compass.

2. C1

3. Shop

B

1. 28 If your child wrote 56, they added the two bars. Ask whether the gap should be bigger or smaller than the taller bar.

C

1. 40 If your child wrote 42, they read the renewables bar. Ask them to put a finger under the fossil fuels label first.

2. 42 If your child wrote 40, they read the fossil fuels bar. Ask which label sits under the middle bar.

3. 14 If your child wrote 42, they read the renewables bar next door. Ask them to point to the nuclear label at the end.

4. 2 If your child wrote 82, they added 40 and 42. Ask whether the gap should be smaller than either bar.

D

1. Look for: Says coal is only part of the fossil fuels bar (40%), which is smaller than renewables (42%), so coal cannot be the biggest source. If your child agrees with Kit, point to the fossil fuels bar. Ask whether coal on its own could be bigger than all the fossil fuels together.

E

1. Look for: Fossil fuels share goes down because more renewable wind power means fossil fuels supply a smaller part of the total.

Words to use

Say“Which bar is the tallest, and what label is under it? How do you know?”
Instead of“Just tell them the answer, or say Coal, obviously, because coal is the one most people think of.”

After the sheet

On squared paper, draw three bars for 40, 42 and 14, one square for each per cent. Then talk about which bar is longest and why.

Tick what your child got right in StudyDen. Anything missed comes back in a later Look back box, so there's no need to redo the sheet.

The rest of this unit

5 more sheets come with a StudyDen plan, in teaching order:

  1. Energy and our climate(with a plan)
  2. Fossil fuels and power(with a plan)
  3. Power from nature(with a plan)
  4. Small changes add up(with a plan)
  5. Who can solve energy?(with a plan)

Every Year 5 geography worksheet

The worksheets plan opens a printable sheet for every lesson in Years 1 to 6, each with its answers on a separate page for you. It costs £6.99 a month or £59 a year for the whole family, with no free trial.

The full StudyDen plan adds the lessons themselves, marked as your child works, with the worksheets included. It is 7 days free, then £29.99 a month.

Both start with a free account; you choose the plan when you sign up.