Our changing place
Today I can explain how places change and tell facts from opinions.
A Look back3 min
- 1.
Look at the map. Letters run along the bottom and numbers go up the side. Circle the symbol in square B3.
pondschoolshop - 2.
Which compass point is opposite north? Circle one.
southeastwest - 3.
Circle the month with the most rain on this chart.
JanFebMarApr
B Watch me, then you4 min
In a made-up town called Pebble Hill, the council counted new homes in each decade. Which decade had the fewest?
The shortest bar shows the fewest new homes.
The 2000s bar is the shortest, at 10 homes.
So the fewest homes were built in the 2000s.
- 1.
In the made-up town of Lower Ashby, the council counted new roads. Circle the decade with the most new roads.
1980s1990s2000s2010s
C Your turn6 min
Read each question carefully before you answer.
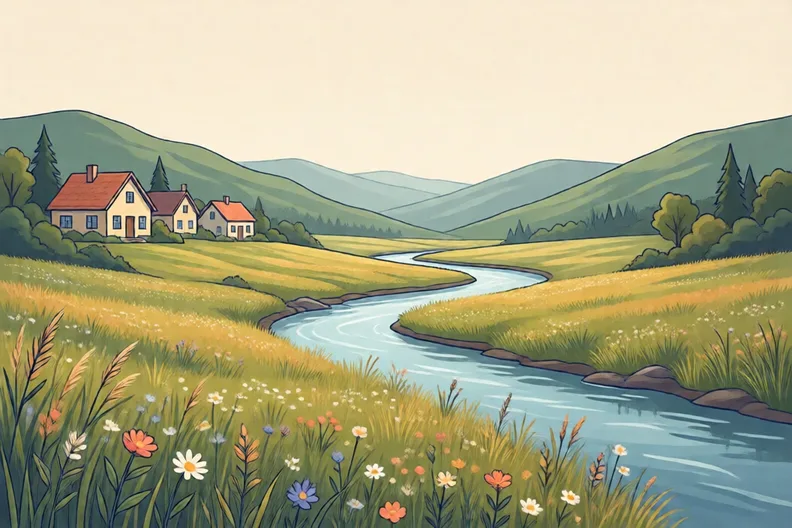
- 1.
Circle the human feature.
a rivera hilla wild meadowa new road - 2.
Write each card in the right column.
a rivera hilla bus stopa schoolHuman features Physical features - 3.
Write each card in the right column.
The town has a library.The new houses are ugly.A pond is in the park.Living in a village is best.Fact Opinion - 4.
Circle the year with the most parks counted in this made-up town.
2019202020212022
Say it out loud: What did you notice about the kind of feature or statement in each row?
D Spot the mistake3 min
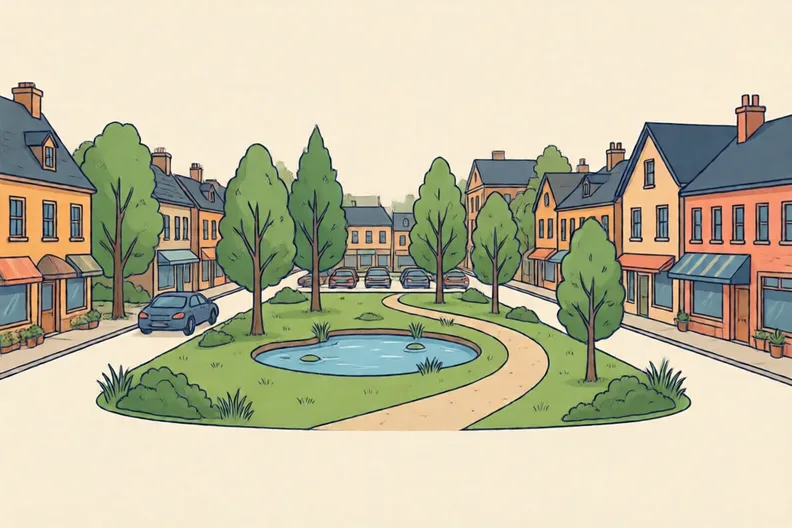
- 1.
Is Ravi right? Give one reason.
E Think deeper4 min
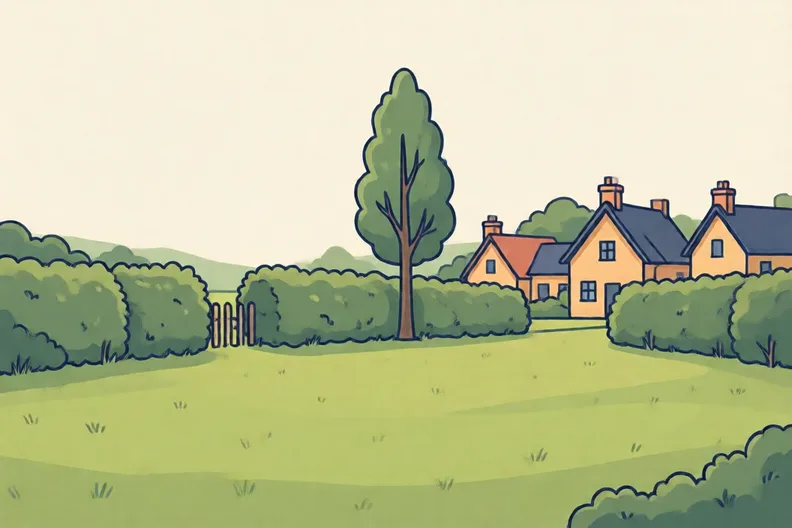
- 1.
Write two sentences about how this field could change over time. Then write one fact about the field now and one opinion about the change.